
The user centered design funnel begins with ideation and ends with usability testing. Ideation is largely dominated by sketching. This enables ideas to be explored quickly and cheaply. Read more about How do you solve the most pressing problems for your customers.
More refined and expensive prototypes provide the basis for testing at later stages of design. The most dominant artefacts are more refined and expensive prototypes. Read more about How rapid prototyping helps save time, cost, effort.
As you progress, the overall investment in the process grows. You don’t manage ideation the same way as usability. Involve users throughout the iterative process, not just during usability testing.
Historically, Microsoft product innovation has been rooted in technology innovation and business thinking, rather than design innovation. However, that is changing. Compelling design is necessary for Microsoft to stay relevant and grow its market share in the enterprise. Design thinking has the power to fuel innovation, transform the ecosystem, change the way customers relate to and use Microsoft products. Microsoft is on its way to make it happen.
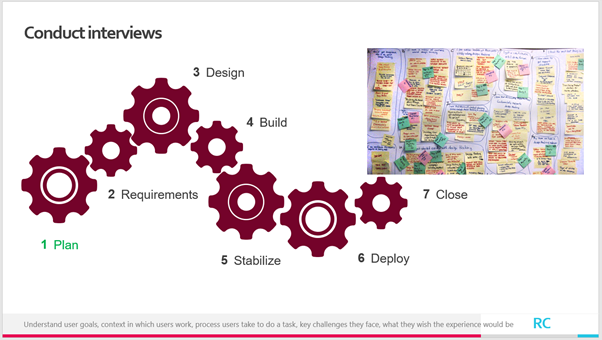
Conduct Interviews
First step is to meet with users and conduct interviews. The objective is to understand user goals, the context in which users work, the process users take to do a task, key challenges they face, what they wish the experience would be. This gives early insight into user experience and factors in their input into the UCD process.
There are different techniques for conducting interviews. One-on-One interview technique includes –
- Preparing the interview script
- Interviewing the users with this script
- Clarifying and recording their responses
Repeat this exercise with each individual user. Typically, the user is a subject matter expert knowledgeable in the business domain and heavy user of the site or app for which you are interviewing.
If the user base is large, you may conduct one or more group discussions with select users. In both one-on-one interviews and group discussions, the user takes a passive role answering questions.
Contextual Inquiry (CI)
Another technique is contextual inquiry where the user takes an active role by demonstrating how he or she performs the tasks using the site or app. CI is inquiry of the context conducted in user’s natural environment. This makes the insights closely connected with the users and their tasks.
As a user researcher, you observe the tasks performed by user and talk about what he or she is doing while performing them. Typically, users are not experienced in leading a CI. Therefore, expectation setting and managing users is important for contextual inquiry to be successful.
CI is usually performed with one participant at a time and in an environment where the participant performs their tasks. Rather than recruiting one participant to perform all tasks, the tasks may be split among different participants to observe and understand all tasks in depth and not exhaust or tire down one participant.
Advantages of CI
CI offers many advantages –
- It produces detailed information in user’s context
- It’s driven by users in their work environment
This makes the insights closely connected with the users and their tasks
Disadvantages of CI
- It’s time and resource consuming
- One user performs CI at a time
Typically, users are not experienced in leading a CI. Therefore, expectation setting and managing users is important for CI to be successful.
Recommendation
Use CI if you want to capture a process in its natural setting. Let’s say, you want to understand how a fitness coach goes about his coaching in a way you want this to be developed into a software/ app. In this case, interviewing a coach may not be productive as the coach may not be able to retrospect and tell you all the nuances that are necessary. Further, interviewing the coach outside of fitness center setting may also not yield the right results.
Create Personas
Personas are defined as ‘an archetypal representation of an actual user group whose members share similar needs and goals’. Personas are empathetic descriptions of key customer segments. They are based on real data from real people, collected and collated into a summarized character. The description includes user’s background, lifestyle, interests, values, goals, needs, behavior, attitudes and other pertinent customer attributes. Each category will have multiple personas.
Strong personas describe drivers that affect how users approach a given solution. These drivers define the practical design considerations such as features and content that product should offer.

Advantages of Personas
- Personas are human centered
- Personas simplify the design process since the designer gets insights into categories of users
- The design solution is close to what the user needs leading to higher acceptance rate
Disadvantages of Personas
- Personas will not reflect all attributes of each individual user. This may lead to missing details.
- Creating personas based on user research, recruiting and interviewing them requires significant time commitment from all stakeholders, including users.
Recommendation
Personas is an indispensable activity in the UCD process. They become the basis for product planning, opportunity identification, investment decisions.
Create Scenarios
Scenarios are a very powerful narrative that describe a user’s experience in illustrative way –
- They describe an end to end experience
- They are written from the perspective of the user/persona
- They speak to the user’s pain points and goals
- They are technology independent
- They are stories
- They also take the shape of storyboards, mockups, prototypes
- They focus on problem resolution and solution design
Benefits of using scenarios
- They provide clarity and focus for project teams
- They focus solutions on the user experience rather than sets of functionality
- They allow you to envision solutions without knowing the details
- They are consumable throughout the product lifecycle
User scenarios answer:
- Why did this story happen ? … the primary goal of the scenario
- Who is the story about ? … the primary actor in the scenario
- What is the plot ? … the sequence of activities
It’s not important to map all possible scenarios; only key scenarios need to be mapped. Use scenarios to validate user needs, behavior, goals during usability study.

Tools
Drawing sketches is a simple way to create scenarios, get quick feedback, discuss ideas with the team. Showing the sketches to limited number of users helps the team quickly understand the pros and cons of each option. A storyboard is a visual representation of a particular scenario. Read more about How sketches help save time, cost, effort.

Advantages of Scenarios
Writing scenarios is a creative exercise. It helps you think beyond the obvious and find alternate ways to help users achieve their tasks that is better, faster, cheaper. Scenarios provide an in-depth understanding of the needs, motivations and context of the users.
Disadvantages of Scenarios
Writing and mapping scenarios is a time consuming exercise. It requires a lot of time and cost investment to 1) define the personas with the help of the potential users 2) recruit experienced researchers to map scenarios.

Recommendation
Making, discussing, ideating on scenarios is one of the most essential stages of UCD process. Scenarios provide the foundation for UCD. Use scenarios as an ideation exercise. Discuss scenarios creatively and find alternate ways to help the users perform the tasks that are better, faster, cheaper.
Map Taskflows
Map the user tasks into a flow before creating screens. User taskflows depict the steps a user takes to complete an activity. The purpose is to identify problem areas and articulate design solutions.

Map Interaction
Show flow of screens with sketches and wireframes

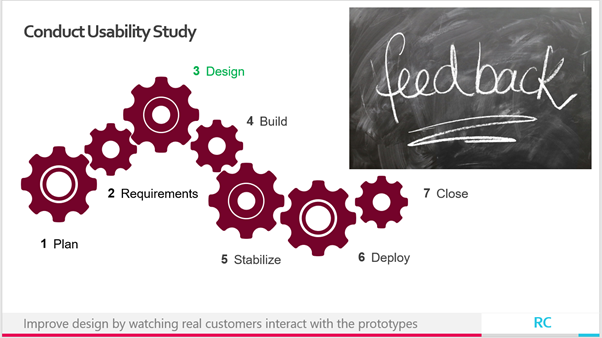
Conduct Usability Study
The goal of usability testing is to understand how users experience the design when executing the scenarios. The usability of products can be validated at any stage within the UCD process through observing real user interactions with the design (sites, mobile devices, prototypes, etc.). This performance based evaluation is particularly useful to evaluate the usability of concepts, prototypes, physical or software products, service offerings of an organization.
Usability testing is grounded in behavioral observations and feedback to provide design insights. This research generates actionable findings to diagnose the problem and redesign your product. Early detection of usability issues saves time, cost, effort in the long run. This leads to increased user satisfaction when the product is released.
How to conduct usability study
Users try to accomplish the tasks outlined in scenarios or storyboards on their own. They do this with the prototypes designed in the form of sketches, wireframes, etc. You observe if they are able to accomplish the tasks end-2-end without any errors or issues. Gather issues encountered by users. Rank and prioritize the issues. Track task success and user satisfaction. Observe the users, not just ask them.
Advantages of Usability Study
Usability study validates the scenarios by getting early feedback within the process. The data collected can be used to improve the product. Evaluate the product against similar and competitive offerings.
- Real data from real users – not intermediaries
- Provides data for design decisions – not opinions
- Save development time by avoiding extensive re-work
- Nothing is more powerful than observing real users using your tools
Disadvantages of Usability Study
Conducting usability study with a large base of users can be challenging in terms of cost, effort, co-ordination. It requires significant time commitment from the users.
Types of Usability Study
Make it a habit – Don’t wait until the end, find problems early, find problems often throughout the process
- Performance Tests
- Usability Test
- RITE = Rapid Iterative Testing and Evaluation
- “A” – “B” Testing
- Benchmark Study
- Non-Performance Tests
- Expert Reviews
- Heuristic Evaluations
- Surveys
| Formative Testing | Summative Testing |
| Conducted during the development Usability Test | Conducted at the end of development Benchmark Study |
| Determine if a specific design objective is met | Validate that a product has accomplished intended goals |
Recommendation
In the simplest terms, experiences are useful, easy to learn and use, compelling, and satisfying. Usability study is an integral, required component in the UCD process.

No design project is complete without user validation. You run a high risk of poor adoption if you do not employ usability study within your design process. Read more about How to improve usability by leveraging design best practices.
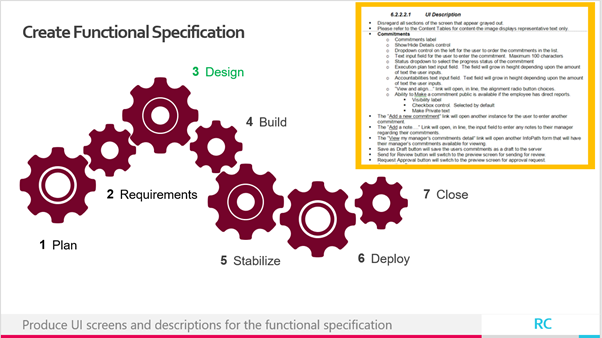
Create Functional Specification
Produce UI screens and descriptions for the functional specification
What has most value
Companies that are successful exploiting the full potential of design do so because it’s present in all of the decisions the company makes. These companies aren’t choosing to apply design to their respective business strategies but have chosen design as the fundamental strategy itself. —John Zapolski
Historically, Microsoft product innovation has been rooted in technology innovation and business thinking, rather than design innovation. However, that is changing. Halo 3 from Microsoft was the most successful entertainment launch in history, selling $300 million in the first week. The team that developed Halo 3 did so in a collaborative, free-thinking environment, frequently employed user-based prototyping. Microsoft has embraced design thinking, which includes learning new behaviors and ways of thinking, validating design ideas, collaborating across disciplines.
Compelling design is necessary for Microsoft to stay relevant and grow its market share in the enterprise. Design thinking has the power to fuel innovation, transform the ecosystem, change the way customers relate to and use Microsoft products. Microsoft is on its way to make it happen.
How does design thinking work in your organization ?
How do you measure its effectiveness ?
Do share in the comments!
Like this article ? How about giving it a like and share ? Thank you!
